The State of Our Wardrobes Is...Concerning
This piece was originally published on the Indyx Substack. Want our latest writing delivered straight to your inbox the moment it drops? Subscribe to INDEXED by Indyx on Substack.
For years, sustainable fashion has been full of good intentions but short on solid data. For a community so committed to change, we’ve had surprisingly little to measure against, especially when it comes to our individual actions.
Total carbon emissions produced by fashion? Tons of textile waste sent to landfill? Sure, we’ve got that. But what’s happening inside our closets between buying that super cute top and donating it a year later? Nobody on earth could possibly know.
We’ve all heard the same stats recycled again and again.
”The average American buys 68 items a year”
“Clothes are worn only 7 times before being discarded”
“People regularly wear only 20% of their wardrobes”
And if you’ve ever tried to source them…you have my condolences. It’s like a never-ending Russian doll of articles quoting articles quoting articles. All for it to end in something like, “well, the Chief Design Officer of California Closets (or, maybe ClosetMaid? It’s unclear) said so in 2013, based on a survey”. (No, seriously! That’s a real example).
We decided it was time to change this.
Today, we released the first-ever wardrobe report (that we know of!) based on real, aggregated closet data. It’s backed by tens of thousands of real digital closets and over 10 million (!) digitized items on Indyx.
No recall bias. No guesswork. Just actual tracked behavior: what we’re wearing, what we’re not, and what that says about us.
A few highlights from the report:
👗The average wardrobe has 166 total items, with 25% going totally unworn in the past year
🛍️ We’re adding a median of 59 items to our wardrobes each year. That’s nearly 5 new items every month! And, nearly 75% of our closet was purchased within the last three years.
♻️ The average item has only been worn 10 times, or just 7 times for clothing.
👜 Our most worn category? Bags & shoes. The least? Dresses.
💸 In general: higher the price tag, the more it’s been worn, with one key exception: clothing from luxury brands has been worn just 6 times on average, making luxury just as “fast” as fast fashion in practice.
Juicy, right?! We’d love for you to read the full report, available to download on our website. We’re calling it the State of Our Wardrobes report because, well… it is.
But wait — where did this come from?
We built this report backed by Indyx’s super rich wardrobe data.
For the nerds among us: don’t worry, we filtered the data (to the best of our ability!) to focus on complete, accurately tracked closets. We limited our analysis to users who:
Joined Indyx over 30 days ago
Have added at least 80 items to their digital wardrobe
Are currently active on Indyx (i.e., opened the app in the last month)
Even with this filtering, our analyzed dataset included tens of thousands of closets. And just to say it: all the data in this report is anonymized and aggregated, never individual!
Depending on the specific stat, we frequently filtered down even further. For example, to create the stat on the number of items added in the last year, we excluded users who have been on Indyx less than a year. Or when looking at closet utilization, we excluded users who haven’t been regularly using the calendar to track their outfits.
Is it a perfect picture of our fashion consumption? Of course not. Anybody who tells you their analysis is perfectly clean and a 110% accurate reflection of reality is lying to you.
But it is a first-of-its-kind snapshot into our closets and what we’re actually wearing — not just what we say we wear. And that matters.
So… what do we do with this?
We’re hoping this report sheds light on what we see as a missing piece in the conversation around sustainable fashion. Which is exactly why we’re releasing it on Earth Day!
There’s been quite a bit of focus on:
Production: How brands can produce clothing more sustainably or ethically
[…]
Circularity: What happens after we decide to remove that clothing from our closets (i.e., resale and recycling)
But we’re talking much less about the in-between: how fast we’re buying and what happens when the clothes are actually in our closets.
Which, arguably, is the entire point of fashion and all the fuss we make about it! What are we doing making all this stuff in the first place if not to be worn?
Well, if you consider yourself a member of the “sustainable fashion community”, we’d be thrilled if you spread the word about these new benchmarks! Now that we have more data, let’s use it to move the conversation forward.
If you're an Indyx Insider, this is where it gets really fun: you can compare your own closet against the report! Here are all the spots in the Insider dashboard where you can do that (and, revealing my own data, here… 👀)
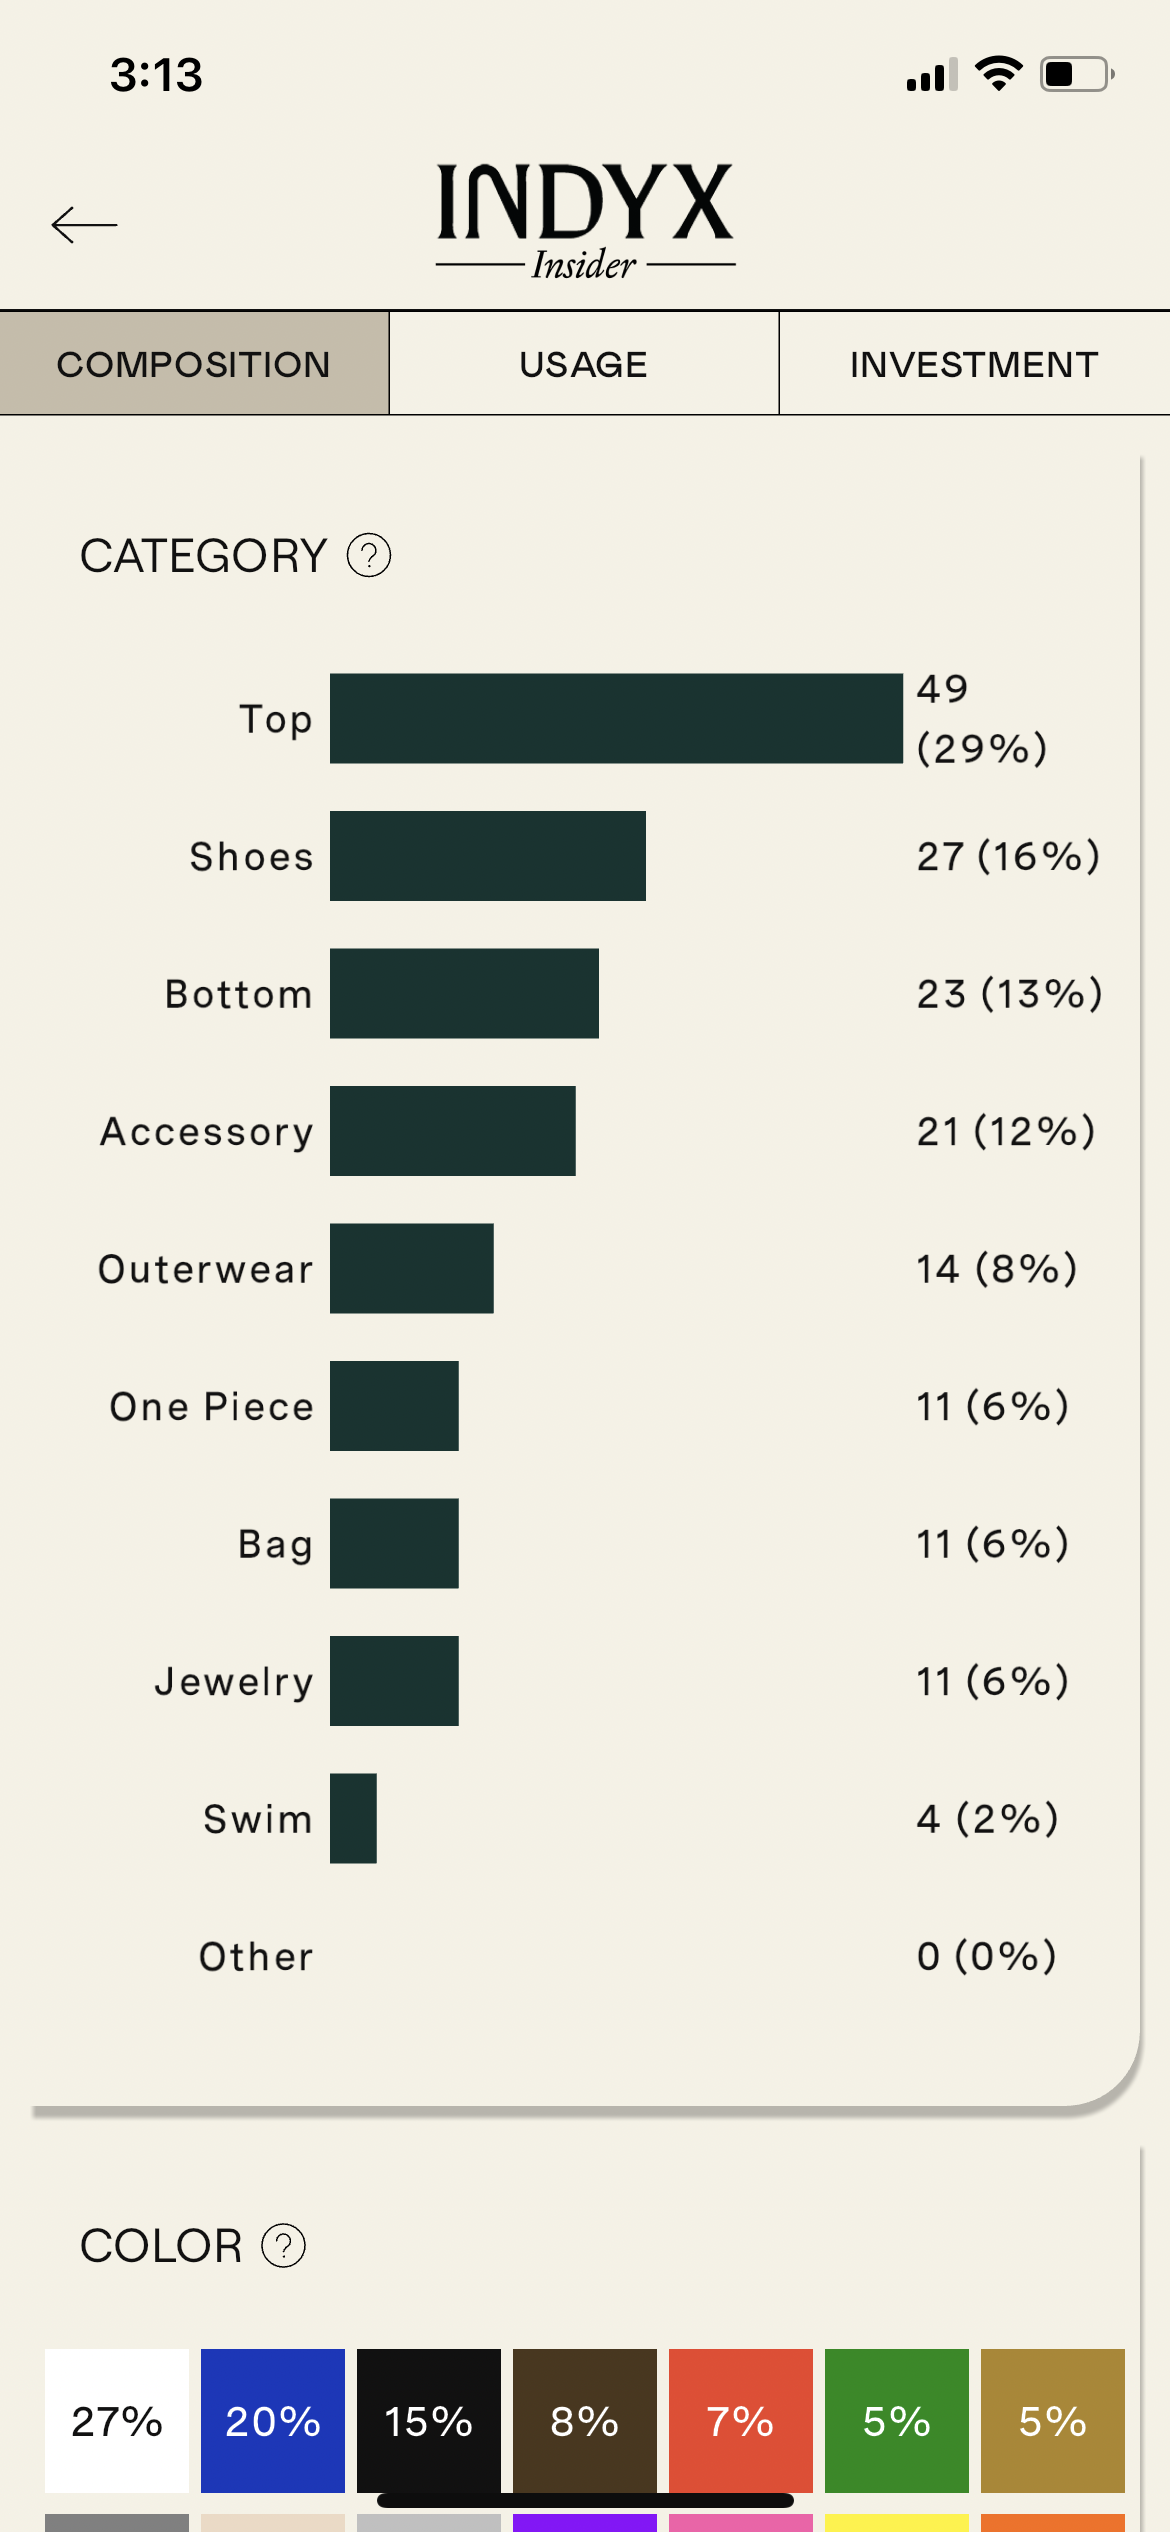
Closet Size & Category Composition:
Compare against page 4 & 5 of the report. Does your closet have more or less than 166 total items and 68 tops?

Items Added:
Compare against page 6 of the report. Have you added more or less than 59 items in the last year?


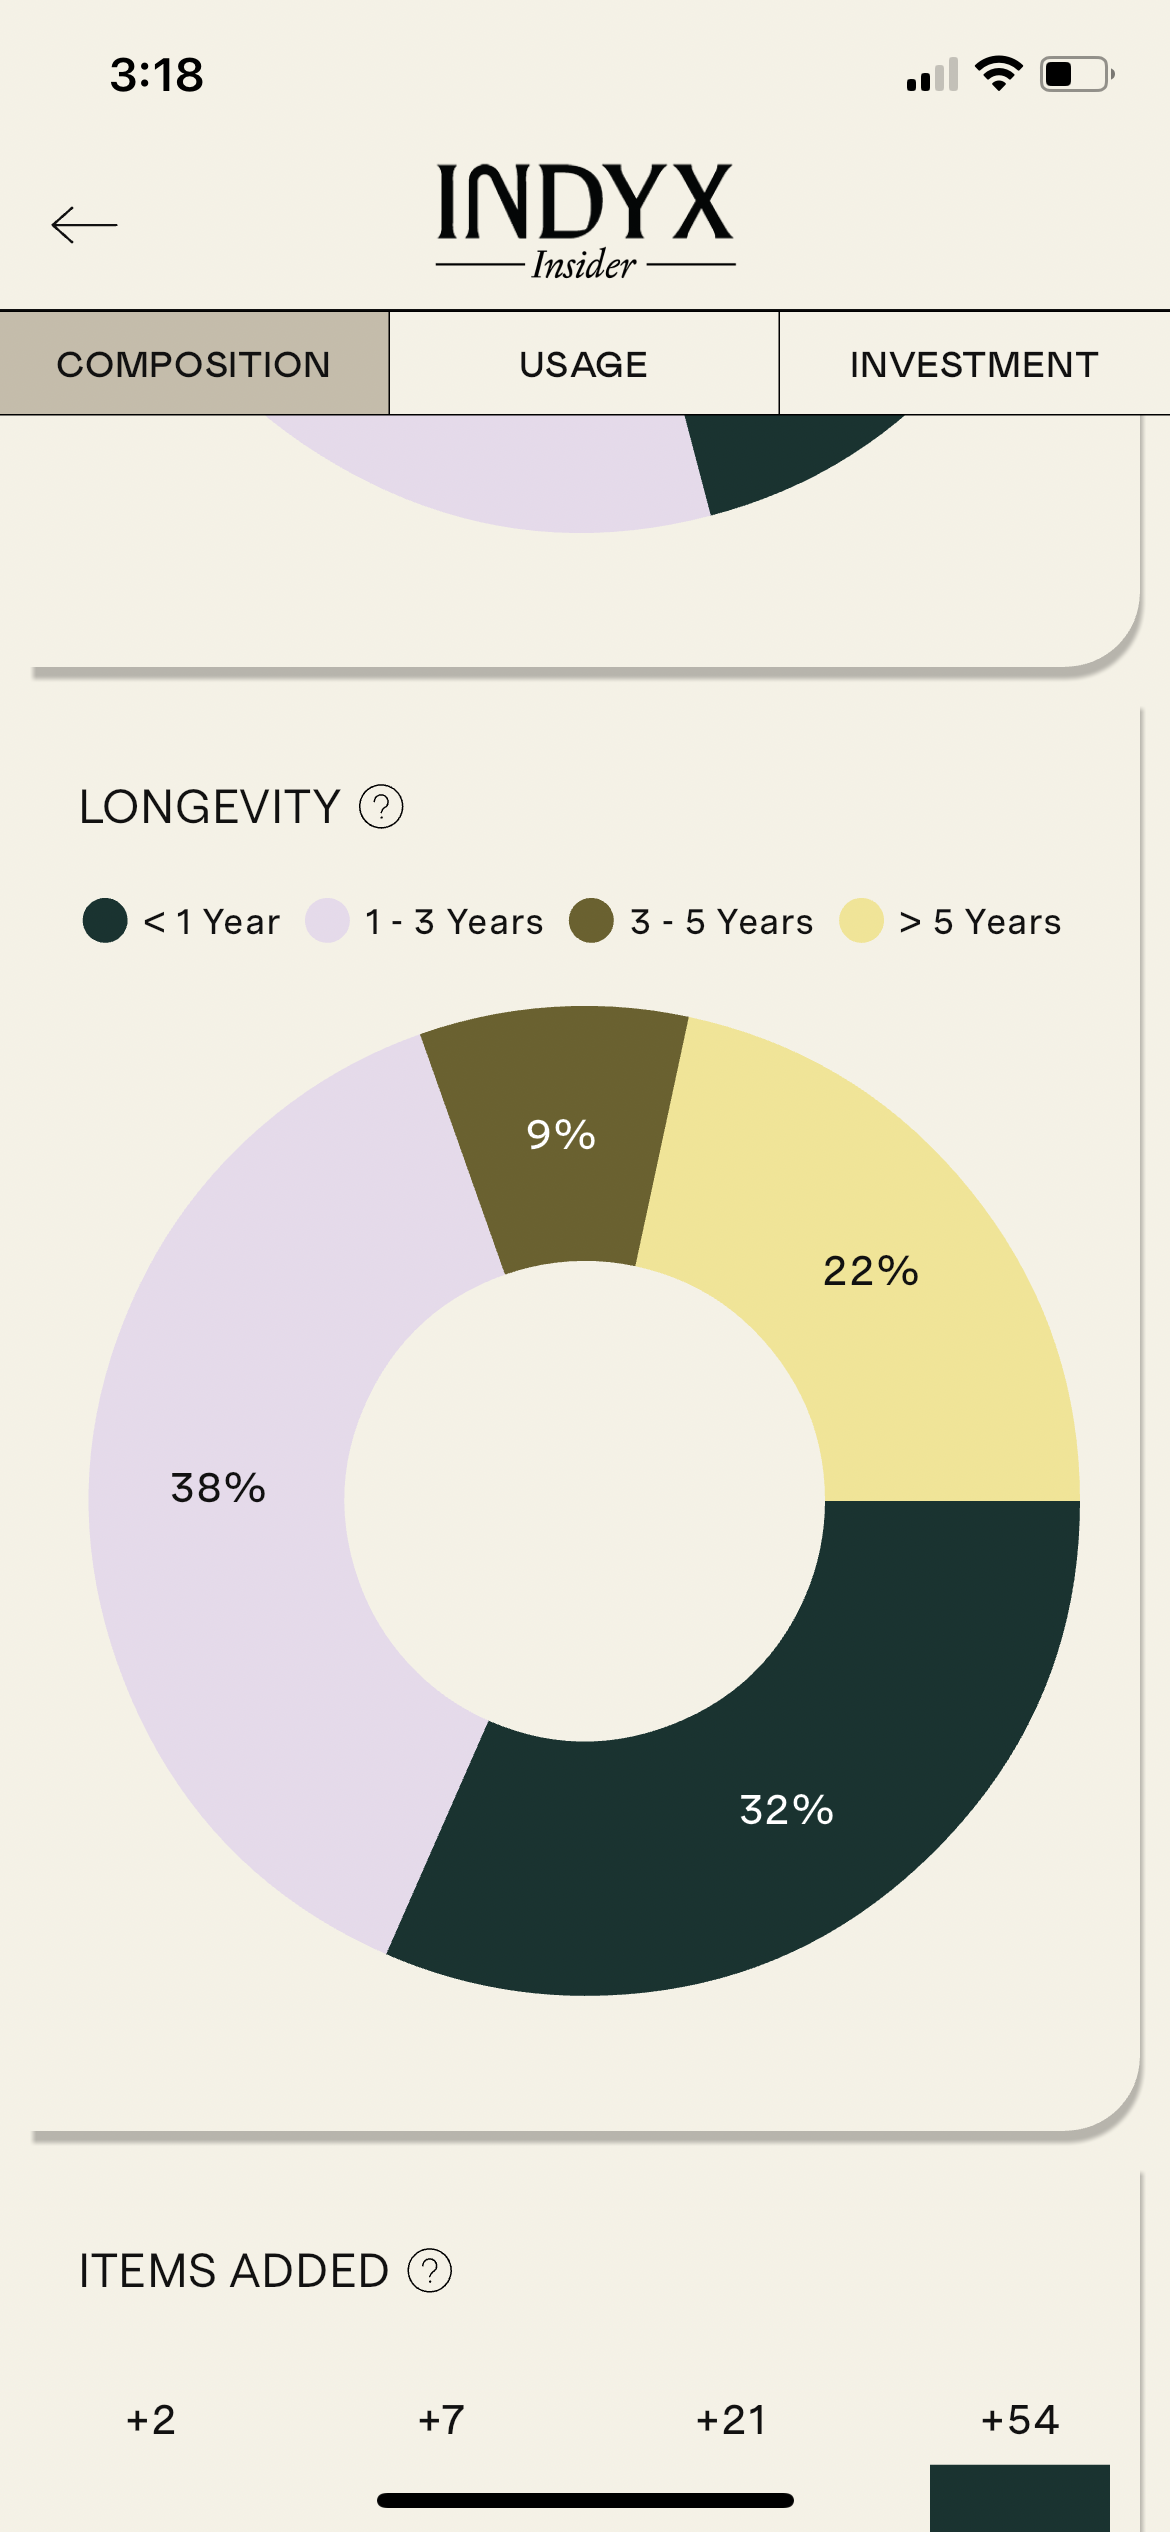
Closet Longevity:
Compare against page 7 of the report. Was more or less than 33% of your closet purchased in the last year? What about the last three years?

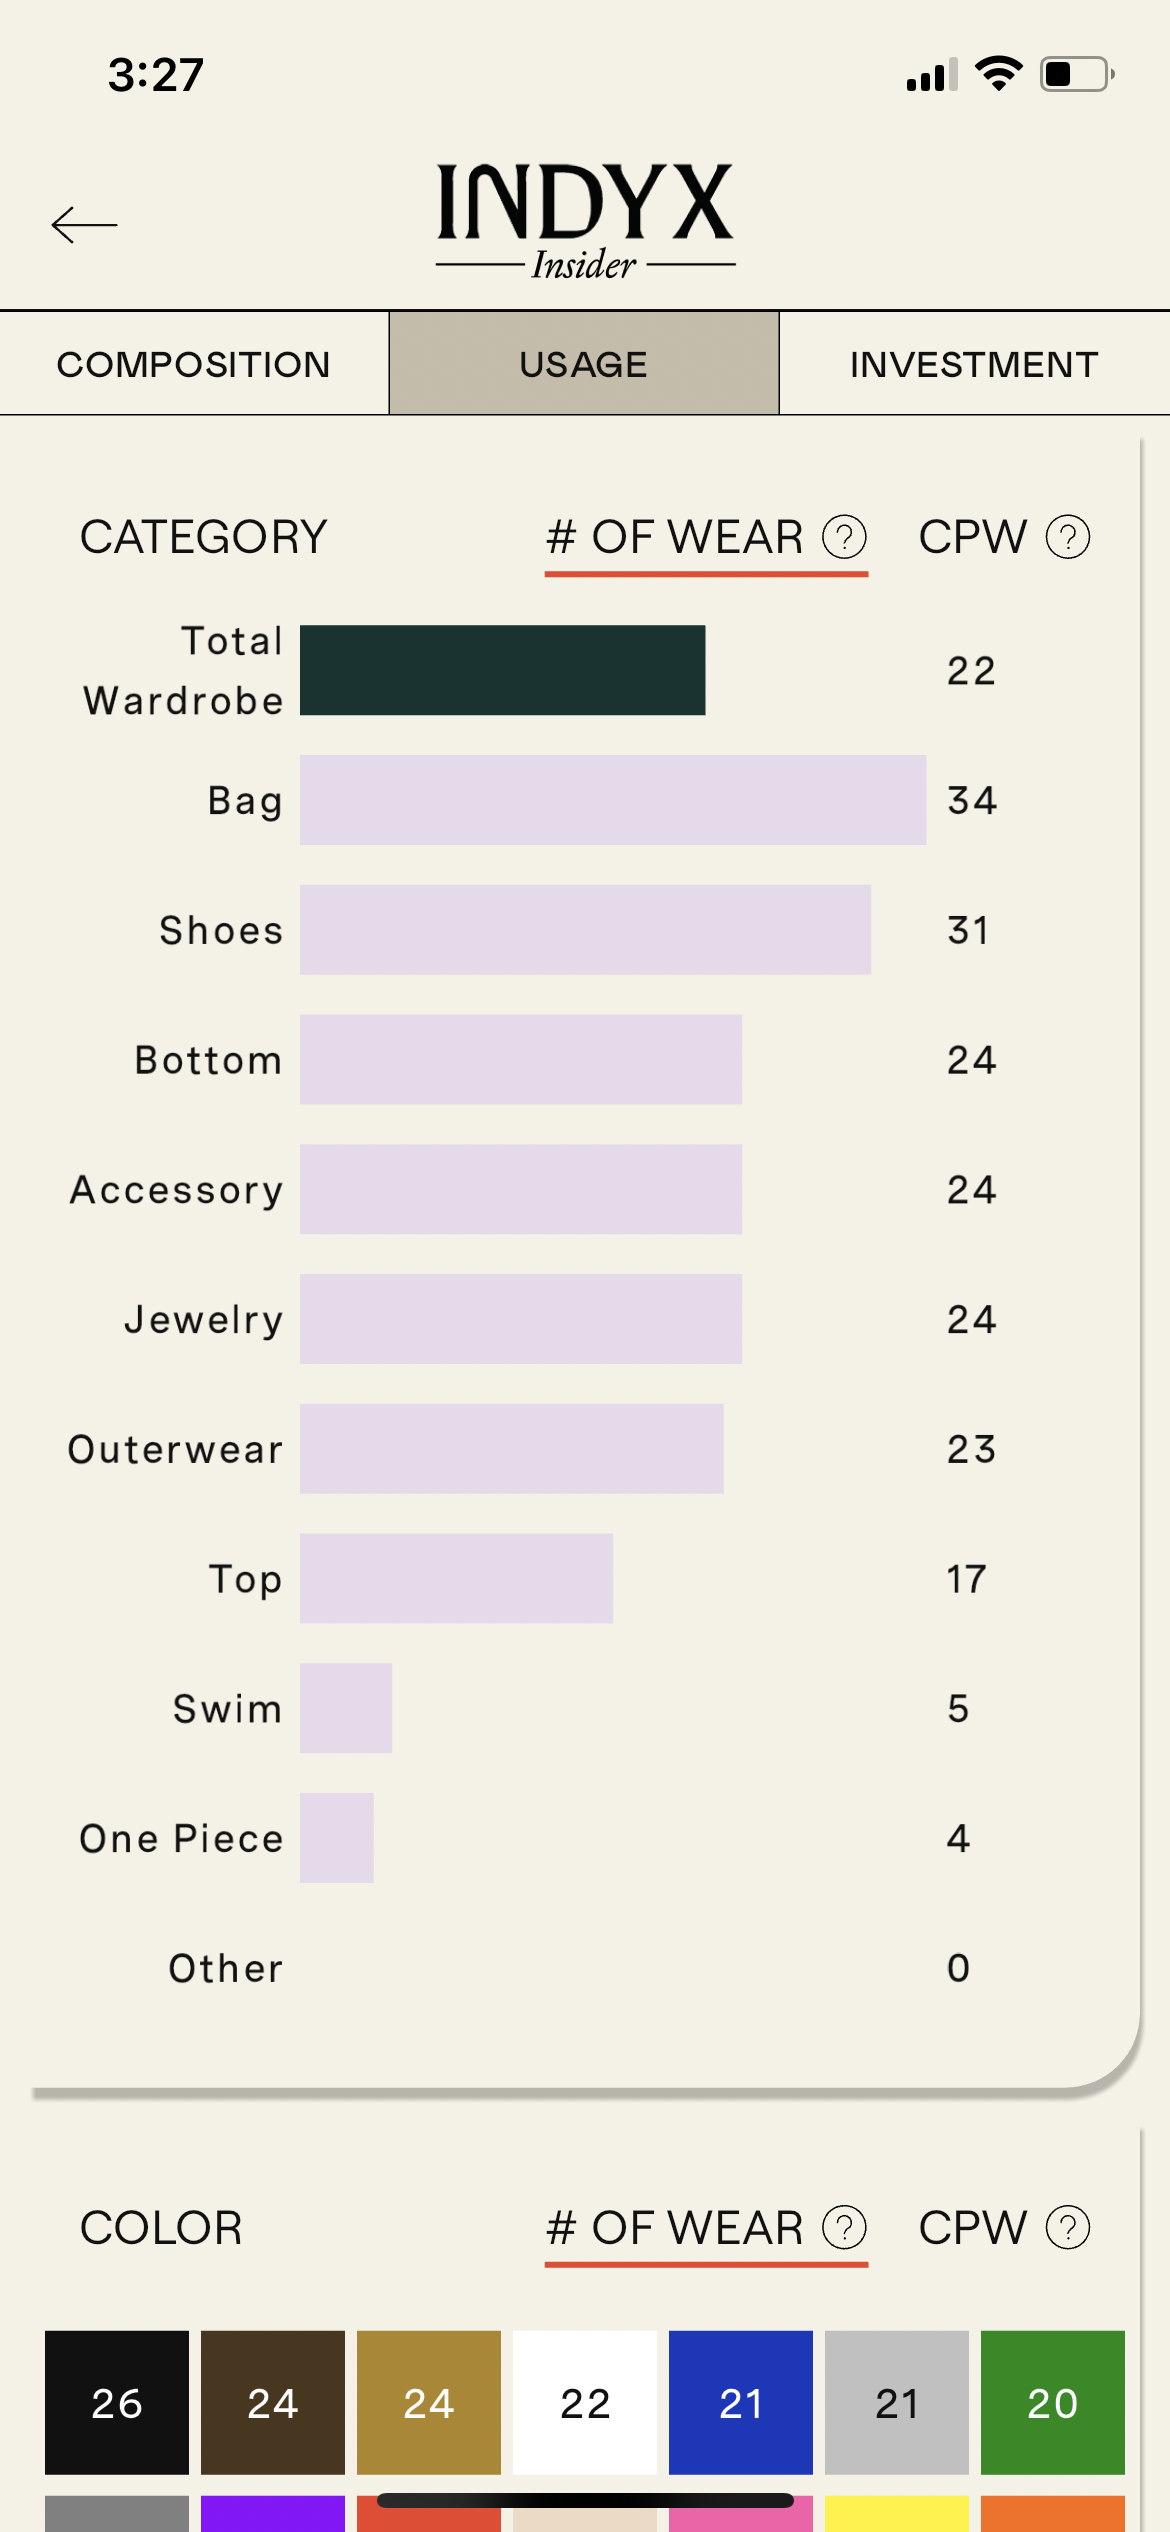
Wears & Closet Utilization:
Compare against page 9 of the report. Is your average times worn more or less than 10 wears? What are your most and least worn categories? And, have you worn more or less than 75% of your closet in the last year (that’s the inverse of 25% going unworn)?


Even if you’re not logging every outfit yet, just seeing what’s in your closet is already a huge first step — and we hope this report gives you a north star to grow from.
And now that you know the data, here are a few micro-habits you could make to take action:
Make a concerted effort this week to style (and wear!) outfits using your least-worn closet category
Look at your least worn items this year and consider reselling them to allow for someone else to wear them instead
Before buying something new, ask yourself: “can I commit to wearing this at least 10 times?”. That’s the current average, so let’s aim higher
If you’re dying for even deeper insights…so are we!
There were definitely some deeper dives we wanted to include in this report but couldn’t. At least not yet! In most cases, it came down to limitations with tracking or sample size. We expect this report to get better and better each year as we grow, and here’s how you can help us get there:
Categorize your items. Go into item details and tag its source, whether or not it was secondhand, when you acquired it, and its price. If you’ve gotten rid of the item, add the date sold or donated. And yes, approximate dates are much better than no dates!
Start using the calendar to track what you wear. It helps us, but honestly it helps you, too! You can log as full outfits or individual items, whatever works best for you.
Spread the word about Indyx! The more people we have on, the larger our total sample, and the more we’ll be able to slice-and-dice into specific segments.
One last time: here’s the full report
This piece was originally published on the Indyx Substack. Want our latest writing delivered straight to your inbox the moment it drops? Subscribe to INDEXED by Indyx on Substack.
Devon is a co-founder of Indyx and currently leads Growth for the company from San Francisco. She enjoys admiring other people’s gardens and sleeping in with her French Bulldog, Reggie.